When we first published our Rule of 50 piece in 2017, we had a lot of people ask us if Growth and EBITDA Margin were equally valuable in the R-Score equation. “R-Score” is our shorthand for Rule of 50 (more commonly Rule of 40) score.
R-Score = Revenue Growth + EBITDA Margin
At the time, we believed that Growth was inherently more valuable, but we had never tested that belief, nor had we quantified how much more valuable it was.
Hypothesis
To build some intuition around this question, we framed our belief as a hypothesis: Revenue Growth (“Growth” or “G”) has a bigger impact on the revenue multiple of software companies than EBITDA Margin (“Profit” or “P”).
Experiments
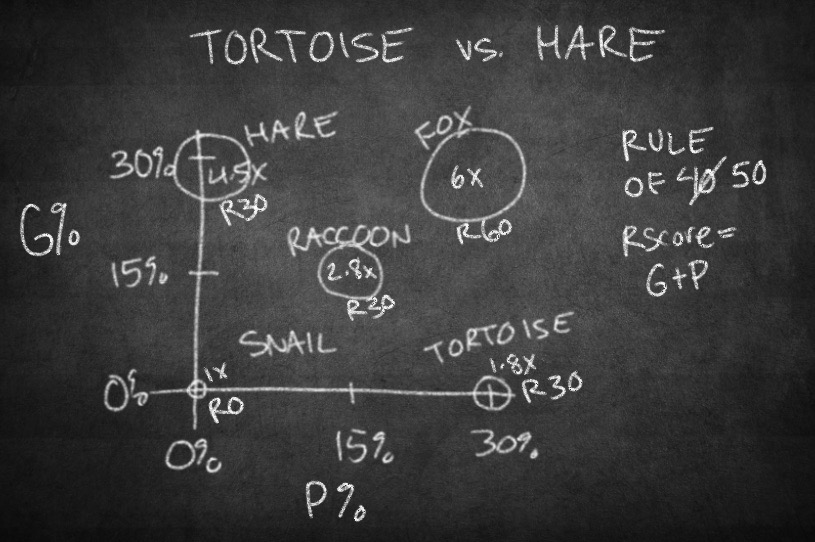
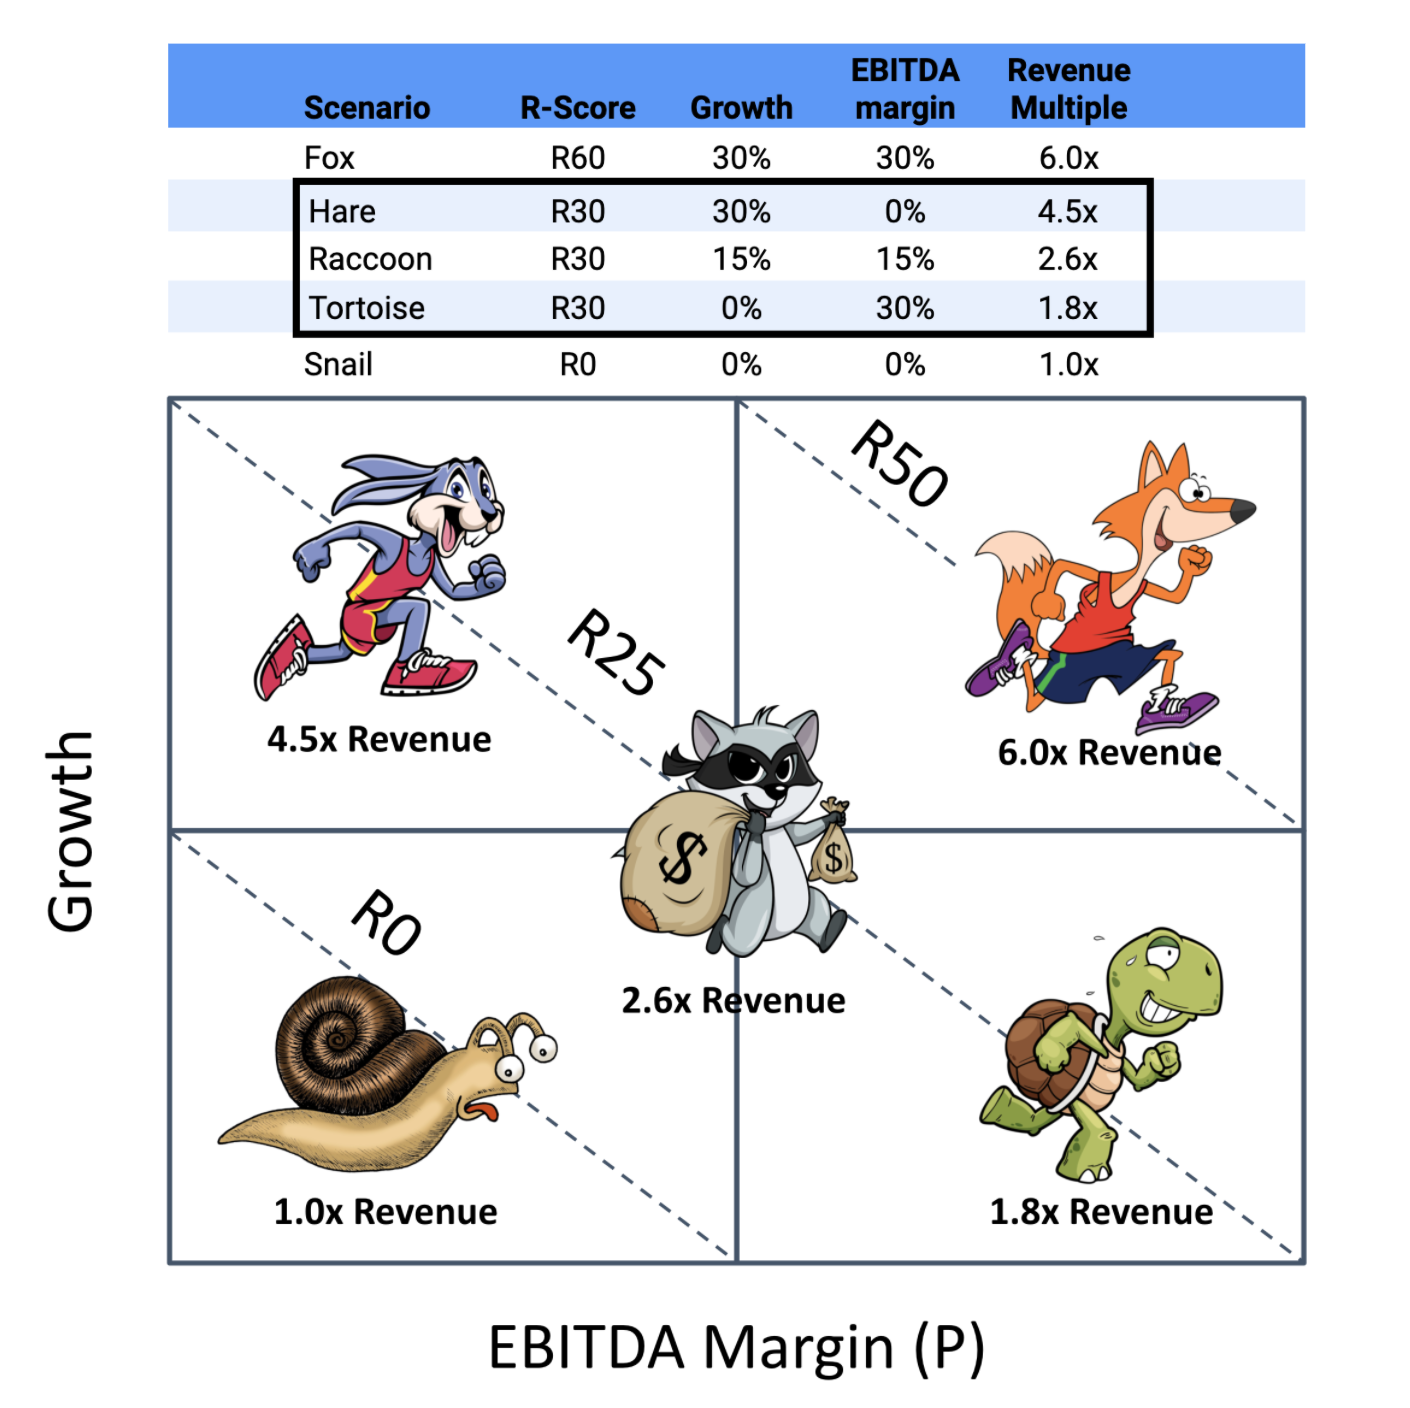
Then we started running “experiments” in our standard valuation model to prove or disprove our hypothesis. In order to isolate Growth and Profit, we held all other variables constant. Each of the five companies we modeled had $15M in revenue, $12M in ARR, 75% gross margin, and 90% retention. We assumed each company had the same size market, the same unit economics (LTV/CAC), the same employee base, and balance sheet, and we modeled the same IRR and tax rate for each (for a discussion of how these other factors impact valuation, see our post from last month entitled “I’m no Peyton Manning”).
We named each of the companies so we could keep track of them. Our Fox has both speed (G) and strength (P). He’s the most valuable forest creature in our menagerie, commanding a 6x revenue multiple. Note that if our Fox had $1.5B or $150M in revenue instead of $15M, and were publicly traded, his revenue multiple would be much higher. Our Hare, Raccoon, and Tortoise each have R-Scores of 30. The Hare is all speed, the Tortoise is all strength, and the Raccoon is equal measures of each. The Snail is R0, possessing neither speed nor strength.
Observations
Through our “experiments,” we observed that Growth impacted valuation more than twice as much as Profit for an R30 company. It’s not quite that simple, though. The revenue multiple function is non-linear. The value of Growth accelerates with each additional unit of Growth. Also, each R-Score has its own curve. In other words, the Fox (R60) and the Snail (R0) are on completely separate curves from the Tortoise, Raccoon, and Hare (all R30). Deriving these curves is beyond the scope of this blog post.
Empirical Public Data
After running our controlled “experiments”, we looked at public company valuations in the SaaS Capital Index to get a sense for how public markets value Growth and Profit. Since we can’t hold other factors constant in the public data, the results aren’t as clean, but the trends are clear. No surprise, Public markets value Growth more than Profit. We can isolate cases on the same R-Score line that seem to support that Growth is twice as valuable as Profit.
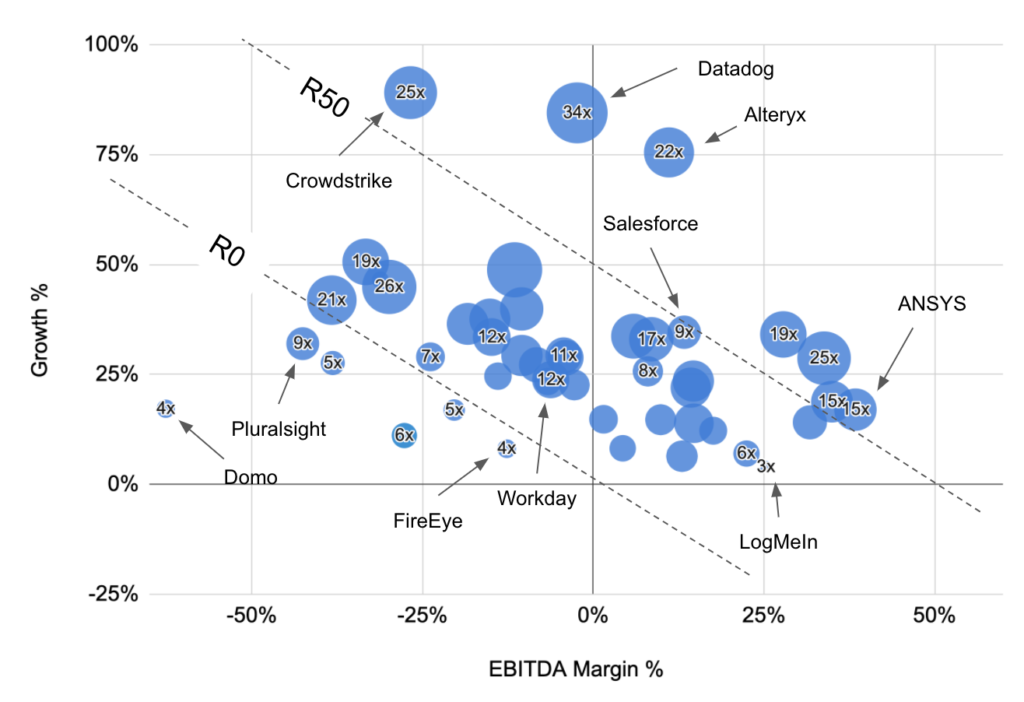
To interpret the chart, we looked at companies along the R50 line, and compared their revenue multiples. ANSYS is an R55 Raccoon (Growing and Profitable), and trades at 15x revenue. Crowdstrike is an R60 Hare (Growing rapidly with negative Profit), and trades at 25x revenue. Crowdstrike’s revenue multiple is nearly twice that of ANSYS with essentially the same R-score. On the R0 boundary, FireEye at -R5 trades at 4x revenue, while Pluralsight at -R10 trades at 9x. The growthier company commands a higher revenue multiple despite a worse R-Score. The market appears to be rewarding even bad growth.
Crowdstrike’s revenue multiple is nearly twice that of ANSYS with essentially the same R-score
Conclusions
We are in a historic seller’s market today. It will be interesting to see how the market values Growth versus Profit after a correction. Our hypothesis is that companies with higher R-Scores will be less impacted than companies with lower R-Scores. Afterall, a high R-Score is an indication of a proven business model where growth and profit are balanced.
For additional resources on the Rule of 40, we found these discussions helpful.
