For the past twenty years, we’ve seen logo charts and different forms of market maps in confidential information memorandums (CIMs), banker reports, Magic Quadrants from Gartner, and many other sources. The maps never really told us much beyond who the biggest, best-known companies were in a space, and who raised the most venture capital.
When we needed more comprehensive maps with relevant details on companies, it took weeks to build them, and the quality varied widely.
So, three years ago, we built a market mapping capability leveraging our proprietary data warehouse at Razorhorse, and it’s been a game changer for us. Now we can build an initial map of a segment in a day, and iterate from there to constantly improve it.
Why Do We Map Software Markets?
When we work with a PE firm on an existing or potential platform investment, they want to know how attractive the M&A opportunity is. They generally know the big names in their space, but almost never have a good feel for the ‘long tail’ of smaller tuck-in opportunities. Similarly, our strategic clients typically know the large, obvious names in their segment, but they don’t know what the adjacent segments in their space look like, and they don’t have a feel for the inventory of potential tuck-ins.
Before we built our market mapping capability, Razorhorse didn’t have much better visibility. We had over 100,000 companies in our database, but we didn’t have a good way of knowing which ones were in a given segment. So, we bought third party taxonomies, and used them to iterate and build our own taxonomies to help guide us.
Once we had taxonomies in place, we needed a way to visualize segments and subsegments by the number of companies, and by aggregate revenue. We also needed to be able to drill down to see growth, profit, capital raised, and other metrics. So, we built a UI that enables us to explore and drill down all the way to our CRM data.
Market Mapping Machine
Over the past three years, we have built over 100 market maps at different levels. Leveraging our database of now over 200,000 software and tech enabled services companies, we can produce a high level map in under a day. When we go deep, market maps evolve as we learn.
TAM
For our projects, we need to be able to start with a comprehensive list of potential targets, or the acquisition Total Addressable Market (TAM). A typical logo splash chart or Magic Quadrant will have a couple dozen companies on it. The TAM for that same space could have thousands of companies. Our maps show us the entire TAM, and allow us to sort and filter on key attributes like size.
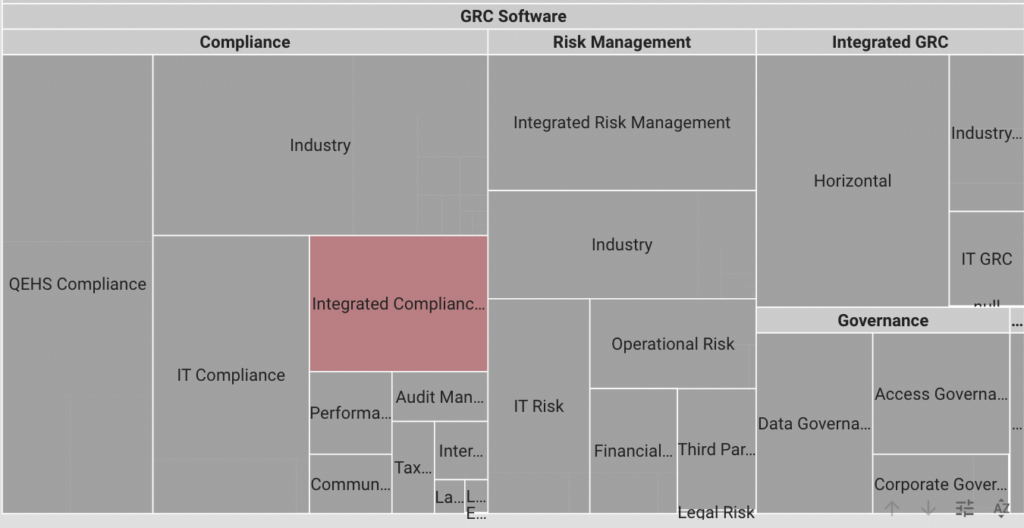
GRC Market Map – TAM of ~4k companies
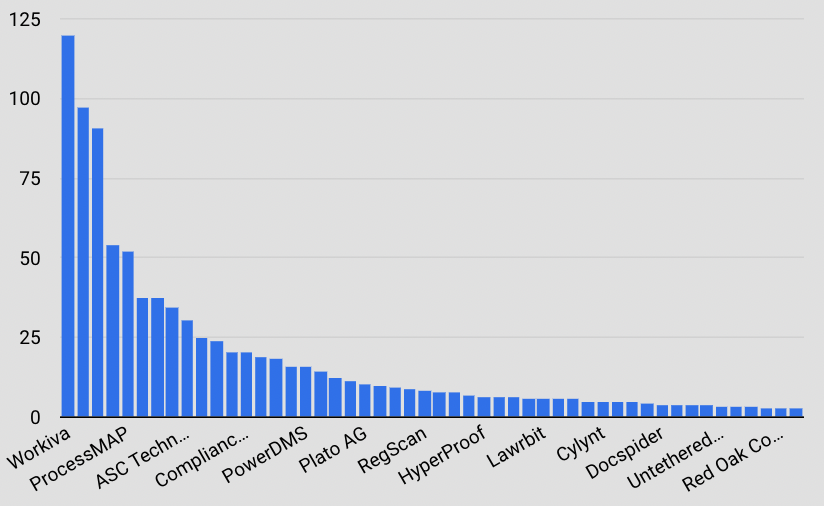
Drill down to a sub-segment showing companies by revenue size
SAM
The first cut we take with our maps is to determine the Serviceable Addressable Market (SAM), which in our case typically means focusing on companies with $5M to $100M in revenue. If there are particularly interesting small companies, we put them on a hot list.
The second thing we do is filter out unrealistic geographies. The vast majority of software companies in our database are in North America and Western Europe. We typically start there from a SAM perspective, but sometimes the geography is more constrained for a given mandate.
After considering geography, we filter for companies that have been acquired or just raised a significant venture round.
From there, we will often further segment a map into Green, Yellow and Red subsectors, with Green meaning high interest for the investment thesis, Yellow meaning maybe, and Red meaning avoid the segment.
The result is a well-curated, comprehensive list of potential targets. Over time, we get to know most of the companies in targeted segments, and in the process, we get smarter and smarter about each market segment.
Information Asymmetry
We have made a multi-million dollar investment on business intelligence infrastructure that allows us to mine our own data. We have been building our database for over a decade now. We talk to thousands of companies each year, and we combine information we learn with information we buy and scrape to build proprietary maps.
As we learn KPIs, competitors, valuations and strategic plans, we keep it all confidential. We only share details with our clients when there’s a qualified opportunity to potentially do a deal, and we never publish confidential information.
We have started ranking segments based on a dozen criteria, and based on a mix of proprietary and generally available (but not easy to assemble) data.
Our process feeds our database, and our database allows us to be more and more effective in our processes.
