
If you’ve followed some of our prior posts, you’ll know we are a bit obsessed with data. Shocking for a team of finance and M&A professionals, we know! But we believe that obsession comes from a solid foundation – we’ve been collecting data about software M&A from conversations with CEOs for more than a decade, and we’ve used the insights from that data to scale our own business. After seeing the “sausage making” for hundreds of M&A transactions, and putting our observations into a robust structured data set, we discovered a wealth of insights that we think can help CEOs and entrepreneurs that are planning to bring their business to market for an exit or fundraise.
We are planning a series of posts delving into several areas of our data set, each with a handful of takeaways we think you can apply to your own business. First, we will start with an overview of the data to give you a sense of the types, scale, and profile of the businesses we have worked with. Next, we will delve into a couple of different functional areas of the business and help you benchmark against some of the KPIs and metrics we’ve found that matter in a financing or exit.
With that preamble, let’s dive into the first part of the series….
The Razorhorse M&A Universe
Our job is to help the strategic investors and acquirers who are our clients connect, evaluate, and transact with promising software businesses that fit their particular mandate. As a result, we speak with more than 2,000 companies a year and evaluate more than 500 for a financing or M&A. When the fit appears strong with one of our clients, we begin due diligence and start collecting data on the business. Over the past 5 years, we have data on almost 600 deals that were evaluated at this level, and it is that granular data that we are using to power the analysis for this series. All of these businesses were either software or tech-enabled services businesses, however their solutions were broadly distributed across industries, geographies, and functional areas.
Revenue
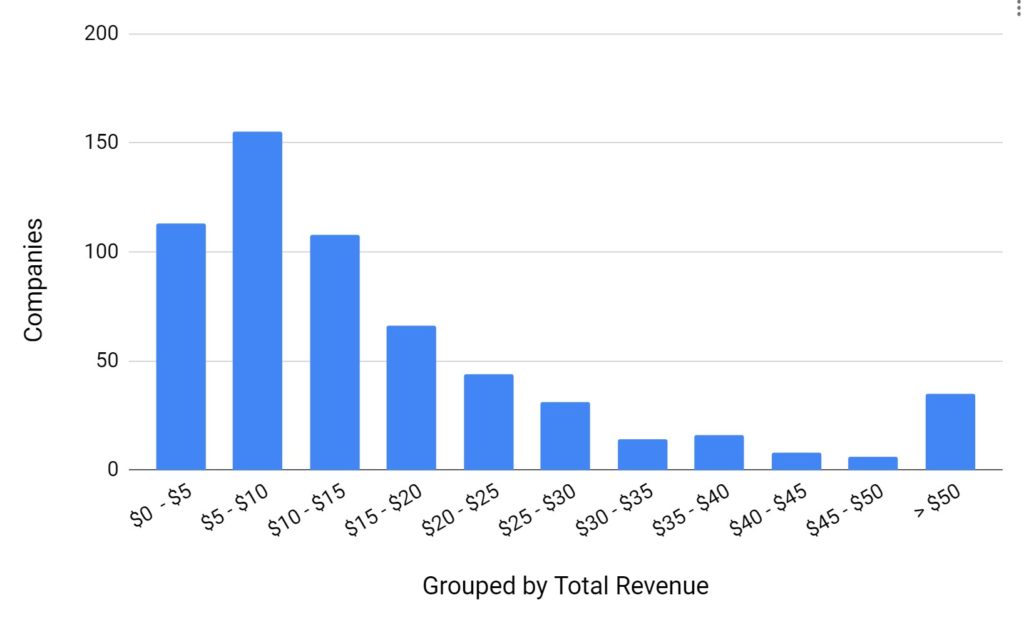
The median revenue across the data set was $11M, however 115 (~25%) were $20M+ in revenue. The most common scale was $5-10M in revenue, and the vast majority of the businesses in our data set are between $0-15M in revenue. Interestingly, this distribution mirrors the same pattern we’ve seen in larger datasets of companies, meaning that the conclusions we draw here are likely a good sample set of all software companies and generally applicable to the broader software universe.
As a CEO, it’s important to focus on data that is relevant to businesses at your similar stage and scale. The process of M&A and the steps involved can look quite different at $2M in revenue versus $30M in revenue, as do the valuation considerations. In our analysis, we will call out some of the differences by scale so you can get a real sense of what “good” is for your business.
Revenue Mix
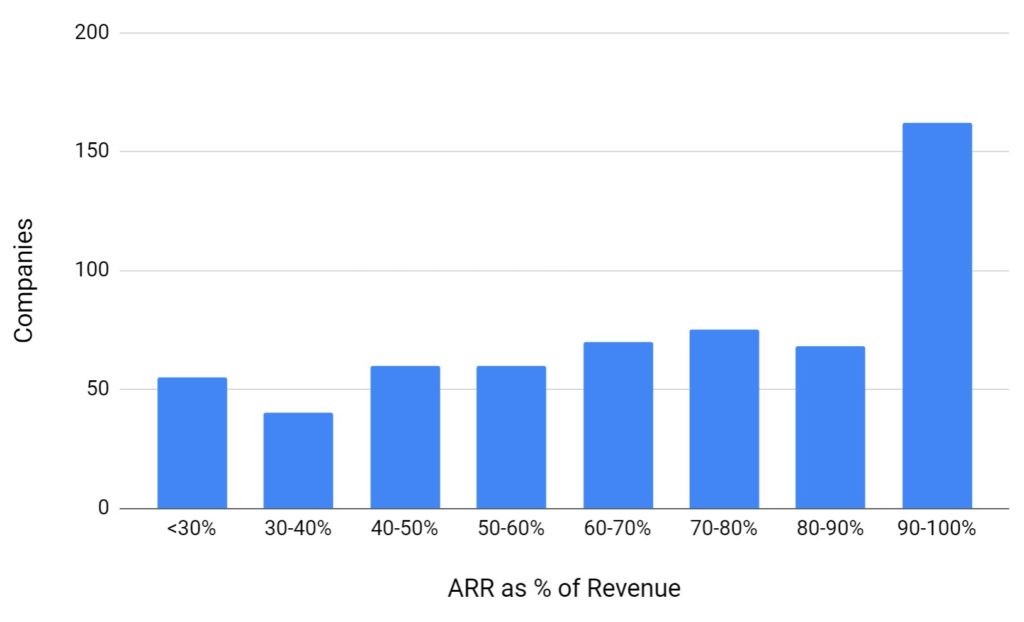
While all of these businesses were software or tech-enabled services businesses, they had many different types of revenue, from one-time perpetual licenses to true recurring revenue to project-based service revenue, and everything in between. We’re careful to distinguish between these different types of revenue as they have different implications for growth, profitability, and ultimately the enterprise value of a business. On average, 70% of the revenue we examined across the companies in our dataset was from ARR or subscription revenue. About 25% of companies we looked at had > 90% of their revenue coming from ARR or subscription. The remainder was most often one-time services revenue, but we would frequently see a blend of perpetual license sales (especially from companies still transitioning to SaaS) and services revenue resulting from the customer success activities to implement and support customers.
Growth
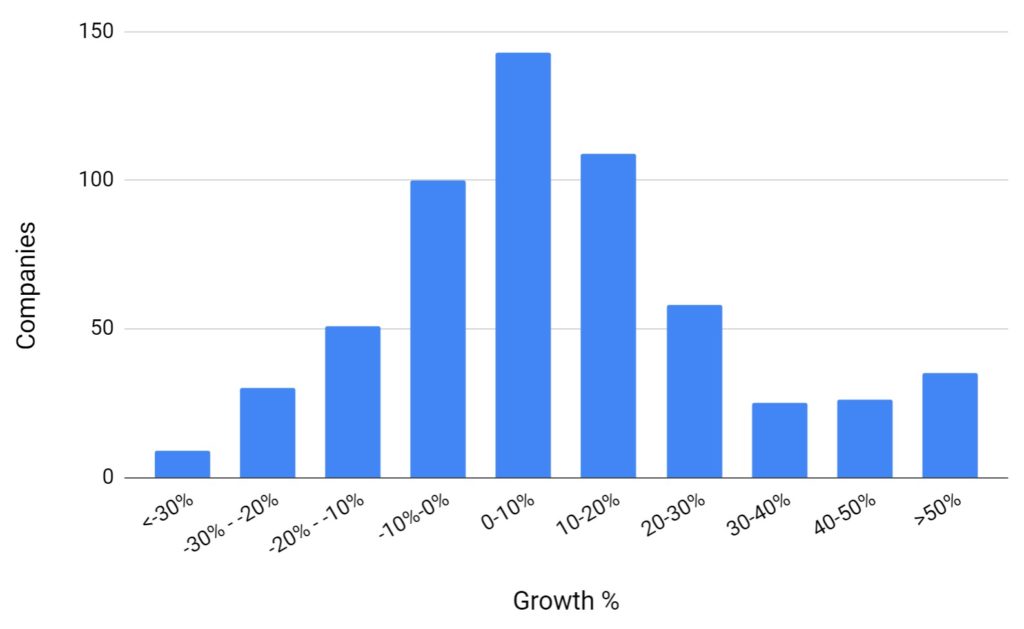
While much of the media coverage of the software industry focuses on hyper-growth business, we’ve found that the vast majority of CEOs and entrepreneurs follow a more incremental approach to growth. The overall median growth of the businesses we examined was 7%, however ARR growth viewed on a standalone basis was a bit faster at 16%. It is also interesting to note that there was a sizeable cohort of flat or declining businesses in our data set as well. While not as attractive as the stronger growth profiles, there are clearly opportunities for exits for all types of businesses.
R-Score
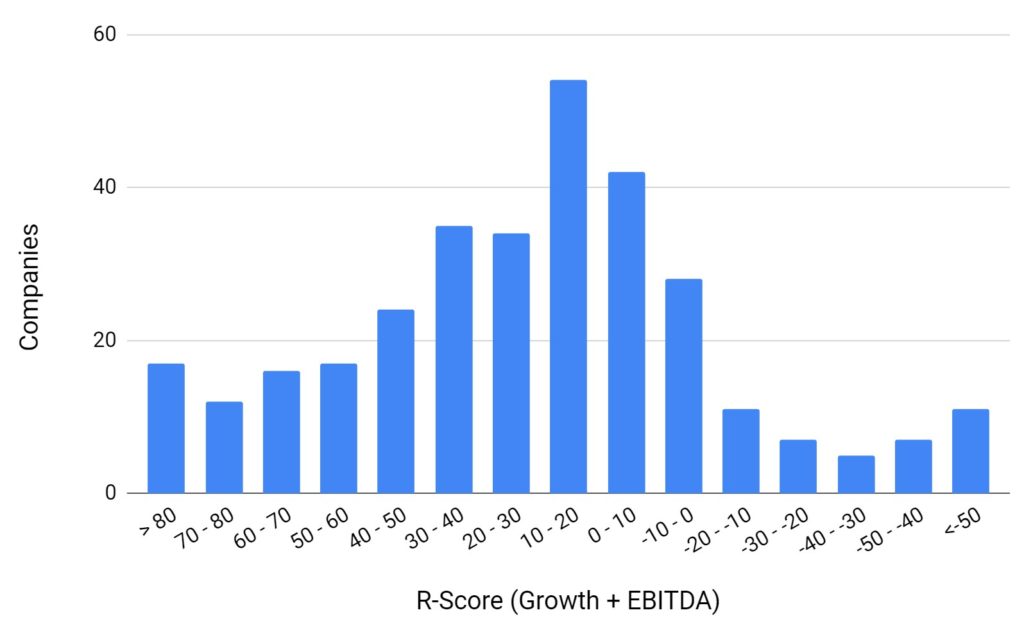
We use a metric internally called R-Score to measure the financial strength of a business. It is simply the sum of [Revenue growth % + EBITDA %]. While there are a lot of nuances to calculating either of those numbers the metric is usually at least directionally correct and gives us a good understanding of the effectiveness of the business model and the tradeoffs being made between growth and profitability. For the roughly 300 businesses in our data set where we were able to calculate a reliable R-Score, those companies had a median score of 18, and about 20% of those had R-Scores > 50. As you can see by the bell-curve distribution however, we had representation of all types of businesses – distressed turnaround situations, high growth/high burn unicorn models, and everything in-between.
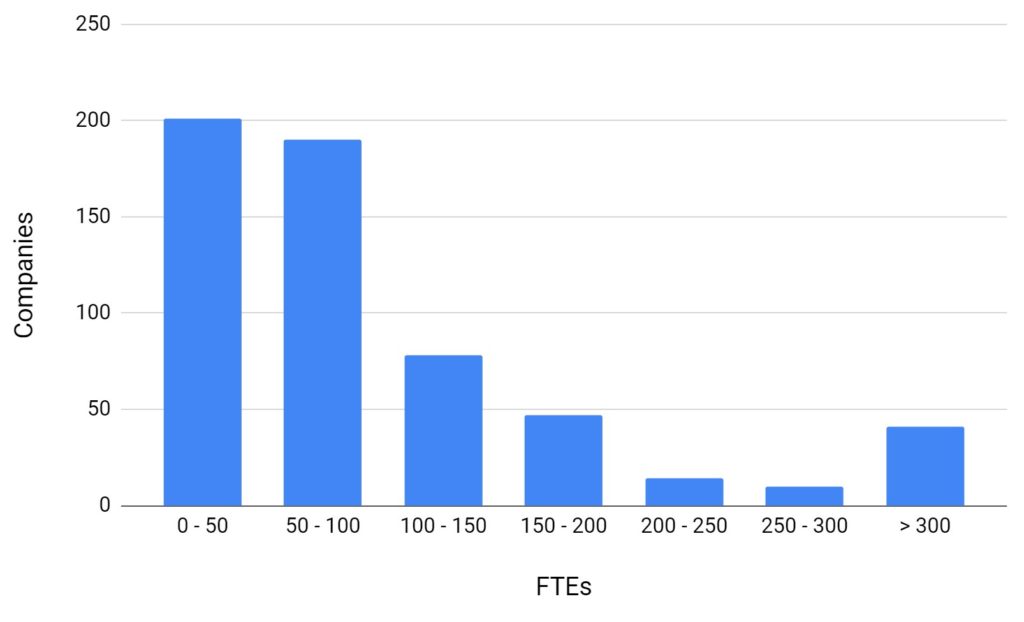
FTEs
Median FTEs for these scale of businesses was 70, and about 2/3rds of the companies in our data set had less than 100 FTEs. While the FTE number by itself doesn’t provide a tremendous amount of insight into a business, some of the derivative statistics we can calculate (Rev/FTE, FTE/$ of ARR growth, etc…) are illuminating and can help CEOs benchmark their efficiency. Context is especially important with this statistic, as a workflow software company will look vastly different than a tech-enabled services business, and even from a highly-technical IP-heavy company.
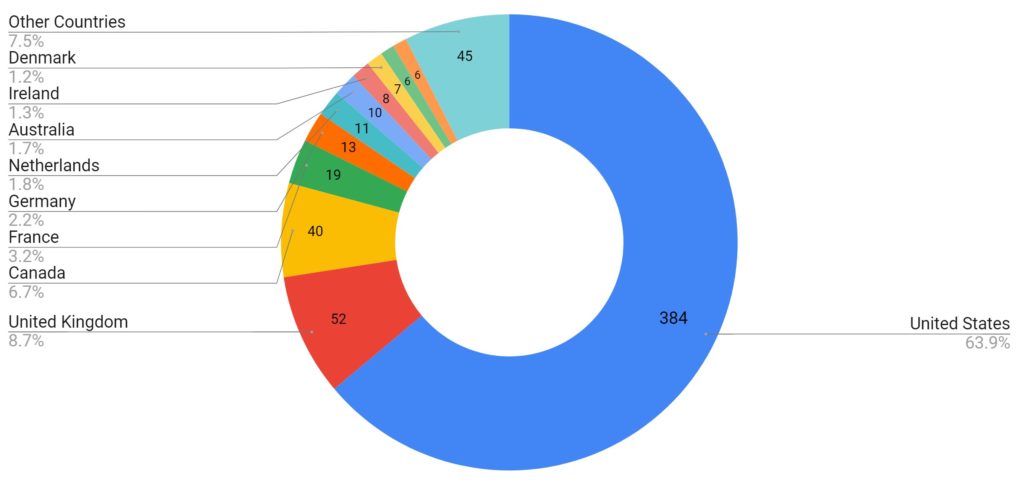
Geography
The vast majority of the transactions we have supported have come from North America and Western Europe, which is reflected in the mix below.
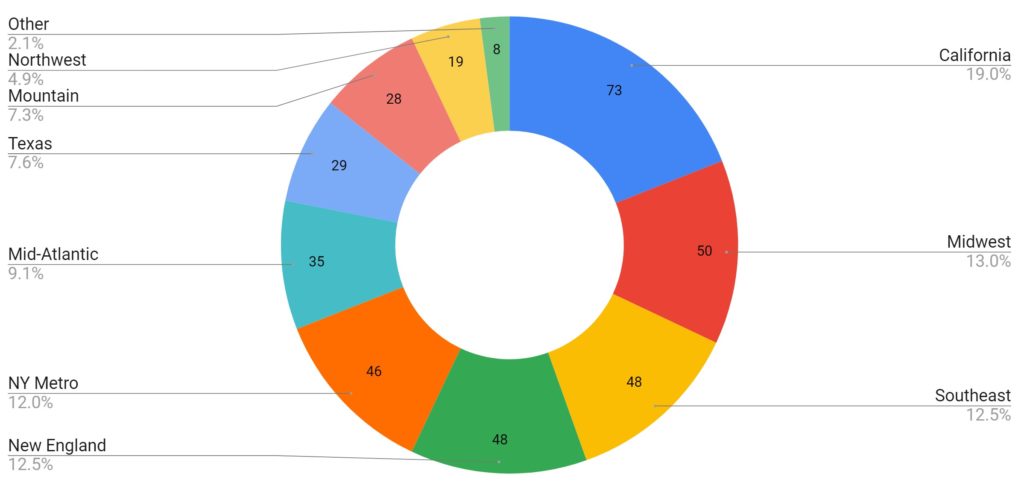
While much of the attention is focused on the tech hubs in the coasts of the U.S., in fact our data is distributed quite evenly across the country. There are great businesses being built, and bought, everywhere across the U.S. While this broad geographic coverage gives a good sense of the average numbers across software transactions, much of the deal specific data, and valuation, is driven by regional factors. As we dive down into the data we will call out areas where there were marked differences by geography and discuss some of the drivers of those differences.
What’s Next
Stay tuned for our next post which will dive into the expense side of the P&L and examine how each component can effect the growth trajectory, and ultimate exit outcome, of a software business.
If you’d like to learn more about our data set or insights, please reach out to us with questions or comments, we’d love to discuss with you.
